POLICY BRIEF | Export potential of Uzbek goods in the EU
This article is part of a policy brief prepared by Veronika Movchan and Woldemar Walter of the German Economic Team and was first published in their newsletter November- December 2020.
Uzbek exports to the EU in 2019 amounted to just USD 160 m or 1% of total goods exports, which is low compared to other Central Asian countries. At the same time, the Uzbek Government is very interested to increase exports to the EU and thus to diversify.
Based on historical trade data and relative comparative advantages, we examine which products have the highest export potential on the EU market. In our calculation we take the forthcoming introduction of EU GSP+ explicitly into account.
We identify three distinct groups of products featuring the highest export potential on the EU market: (1) fruits and vegetables, including products at very different stages of processing – from fresh to frozen to fully processed; (2) metals, comprised of semiprocessed ferrous and non-ferrous metals; and (3) textile and apparel, ranging from cotton yarn to baby apparel and specialised suits.
To tap this potential the Uzbek government and business should identify and remove export barriers, which might include limited production capacity, underdeveloped logistics, limited adherence to EU standards and insufficient marketing.
Uzbek exports of goods to the EU
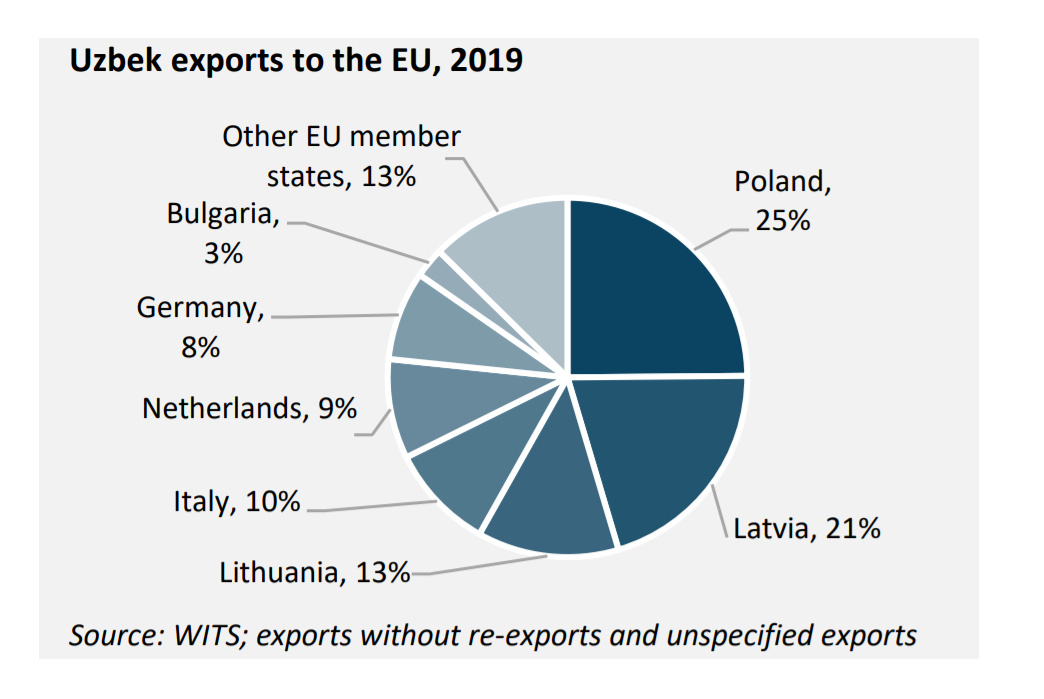
In 2019, Uzbek exports of goods to the EU was approx. USD 160 m (1% of total goods exports). These numbers need to be seen in the context of relatively high Uzbek gold exports, of which none are going to the EU. Nevertheless, is it relatively small in comparison to other Central Asian countries and also to the size of the EU market. Most of the exports were directed to traditional Eastern European markets, with Poland, Latvia and Lithuania being the top-3 export destinations. Other large EU markets like Germany were almost not targeted at all so far.
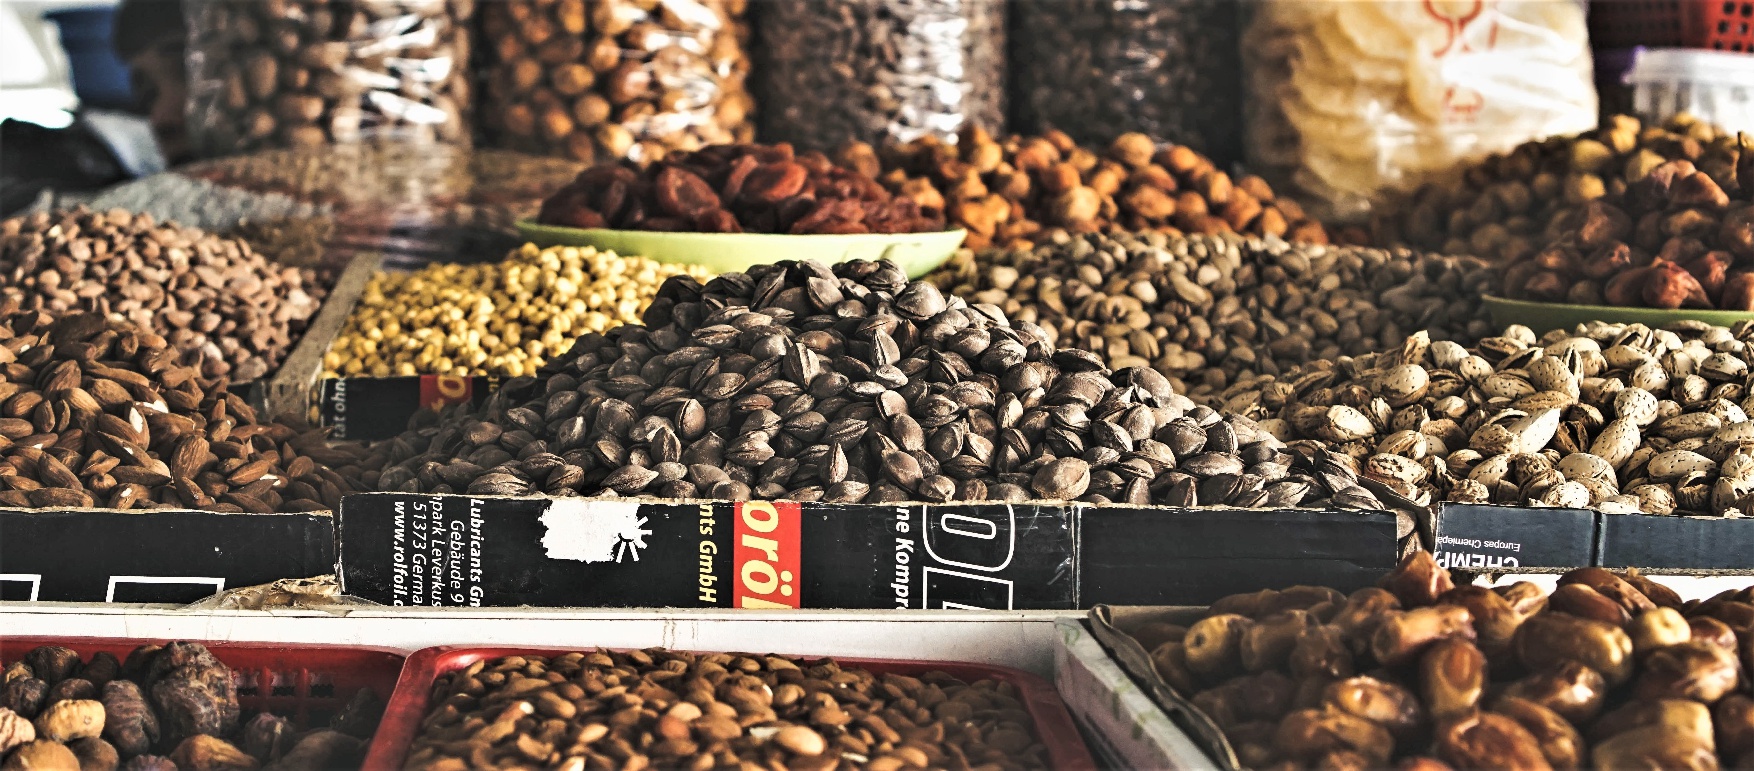
Currently the main products exported to the EU are textiles, including cotton yarn and fabric and knitted apparel like T-shirts, plastics, non-ferrous metals as well as fruits and vegetables.
|
Share of Uzbek exports to the EU, 2019 |
||
|
|
UZB exports to the EU 2019, USD m |
Share of EU in UZB total exports, % |
|
|
19.9 |
2 |
|
Polymers of ethylene |
18.1 |
5 |
|
Woven fabrics of cotton |
13.1 |
21 |
|
Molybdenum |
11.4 |
90 |
|
Grapes, fresh or dried |
10.1 |
5 |
|
Cotton, not carded |
6.0 |
2 |
|
Onions, shallots, garlic |
5.9 |
8 |
|
Refined copper |
5.6 |
1 |
|
T-shirts, other vests |
4.5 |
4 |
|
Aluminium bars, rods |
4.2 |
32 |
|
Other products |
60.9 |
1 |
|
Total |
159.7 |
1 |
|
Source: WITS; exports without re-exports and unspecified exports |
||
For most of these goods, the EU is not the key destination. The only exemption is molybdenum, which is a metal used e.g., for the production of metal alloys to increase strength and heat resistance.
Since exports to the EU are still relatively low, a diversification of export markets would certainly make sense. Additionally, the Uzbek government is very interested to increase exports to EU. Against this background, we calculate which Uzbek products have the highest export potential on the EU market.
Methodology to estimate export potential
The assessment is based on the modified International Trade Centre (ITC) methodology. We use relative comparative advantage based on historical trade data to consider four dimensions:
- Supply side dimension: export performance of Uzbek products in the world,
- Demand side dimension: import performance of the EU in the world,
- Trade interaction dimension: potential competitiveness and current presence of Uzbek goods on the EU market,
- Trade barriers dimension: trade regime including through forthcoming introduction of EU GSP+.
First, we estimated normalised scores for each dimension and construct compound export potential indicators as a simple average of the dimension scores for each product of Uzbekistan’s exports.
Next, we checked the price feasibility criterion: a product’s import price in the EU should be between two and four times the export price of Uzbekistan. The lower bound ensures a sufficient margin to cover logistics and other costs. The upper bound is aimed to reduce risk of the selection of non-comparable products. If the price difference between EU imports of a certain good is more than 4 times as high as the export price for this good, they are probably not comparable regarding kind or quality. Products that did not meet the price feasibility criterion were excluded from the further analysis.
Finally, a list of top-20 products with the highest export potential was constructed, which was checked for plausibility during expert interviews.
Products with the highest export potential
We identified three distinct groups of products with the highest export potential on the EU market: fruits and vegetables, metals, and textile and apparel. Fruits and vegetables are the largest category encompassing products at very different stages of processing, from raw materials to fully processed products. The list of high export potential products includes:
- vegetable saps, extracts;
- melons, watermelons;
- grapes, fresh or dried;
- vegetables, fruits, preserved by vinegar;
- other nuts, fresh or dried;
- fruit, nuts, prepared or preserved;
- tomatoes, fresh or chilled;
- vegetables, frozen;
- jams, fruit jellies, marmalades.
Currently, Uzbekistan does not export most of these products to the EU, except for melons and grapes. For them, the share of EU in total exports is below 10%.
Metals are the second largest category, comprised of semi-processed ferrous and non-ferrous metal products including:
- iron bars and rods;
- aluminum bars, rods, profiles;
- copper tube or pipe fittings;
- other articles of aluminum.
Aluminum bars and rods are the only product already showing a strong orientation towards the EU market. In 2019, Uzbekistan shipped 32% of its total aluminum bars and rods there. Uzbekistan also already exports copper fittings to the EU, although at a smaller scale.
Textile and apparel is a traditional export category of Uzbekistan, and the analysis confirms that Uzbekistan has a strong export potential for these products on the EU market. The list of high export potential products includes products at different processing stages:
- babies' garments and clothing accessories;
- cotton yarn
- track suits, ski suits, swimwear.
Uzbekistan already exports baby garments and cotton yarn to the EU, but its share in this export category is only 2%.
The list of top-20 products with the highest export potential also includes several sorts of chemicals, packaging and insulated cables.
Conclusion
Currently, Uzbek exports to the EU are small, approx. 1% of total, but trade intensification is a policy priority shared by Uzbekistan and the EU.
Our analysis shows that there is potential to increase Uzbekistan’s exports to the EU, especially for fruits and vegetables, metals, and textile and apparel.
Uzbek exports will benefit from the forthcoming GSP+, which creates a new price competitiveness edge for Uzbek products on the EU market. To fully tap the potential, the Uzbek government should further support exports by identifying and removing export barriers. These might include in particular limited adherence to EU standards, underdeveloped production capacities and logistics, and insufficient marketing.
The German Economic Team
Financed by the Federal Ministry for Economic Affairs and Energy, the German Economic Team (GET) advises the governments of Moldova, Georgia, Ukraine, Belarus and Uzbekistan on economic policy matters. Furthermore, GET covers specific topics in other countries, such as Armenia. Berlin Economics has been commissioned with the implementation of the consultancy.
A more comprehensive analysis is provided by the policy briefing ‘Export potential of Uzbek products on the EU market’.
Download here
Disclaimer
This article provides a summary of the key findings of the policy brief titled "Export potential of Uzbek products on the EU market" and was first published by the European Economic Team: https://www.german-economic-team.com/usbekistan/wp-content/uploads/sites/6/GET_UZB_NL_09_2020_en.pdf. Views and opinions expressed in this article are those of the authors and do not necessarily reflect those of the GSP Hub.